Considerations for your data capture:
- Actual sample rates may be slightly different from the advertised data sample rates. If highly precise sample rates are required, for example for sensor fusion or across a long capture, please consider calculating the actual sample rate from the timestamps in the data from your unique sensors.
- The reference video is not specifically synchronised to your data. This is due to a limitation in controls the iOS allows for device cameras. If you require a sync, please talk to us about how you can use the sensors and videos to create sync events which can be used to align your data in post-processing.
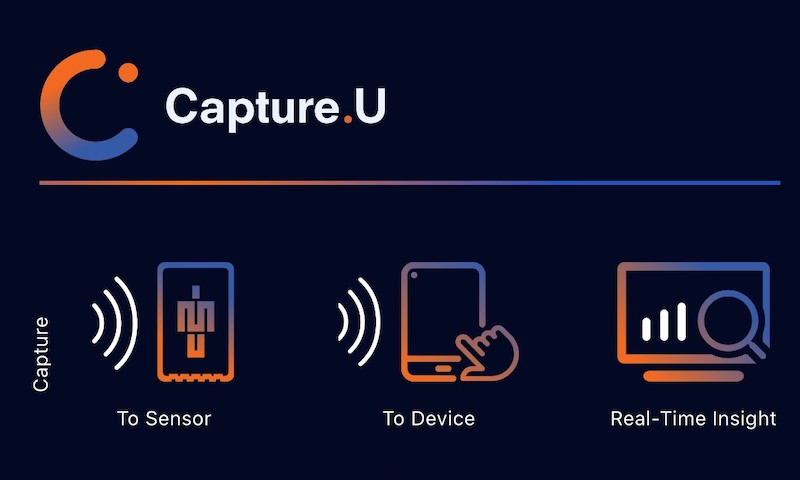
Capture Mode
– Capture to Sensor
Choosing to record data to your Trident sensors is a powerful option allowing you to access the full power of the technology. However, the sheer volume of data recorded is too great to transfer over Bluetooth efficiently, so we have to connect the Tridents to a PC (Windows or Mac) to access the full data set. This requires the orange Trident cradle and a micro-USB cable, both included with your Trident sensor purchase, however any micro-USB cable can work.
Before connecting your Tridents, you do need to have installed the Capture.U desktop app. This software is also used to upgrade sensor firmware, so ensure you have the latest version installed!
Connect your sensors via USB to your PC, open Capture.U and your captured data should populate the ‘Process’ tab. The ‘Sensors’ tab is what you would use to manage your Tridents – firmware, formatting storage and checking available storage and charge.
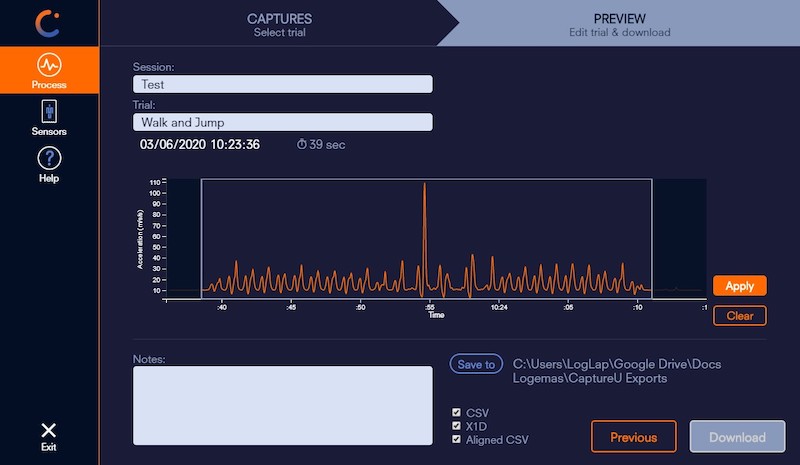
Providing you have already collected some data, this will populate the ‘Process’ tab, organised by Trial Name. Selecting a trial takes you to the Preview panel. Here, you can trim your trial, rename session and trial tages, add/edit notes, choose file save path and select the output format
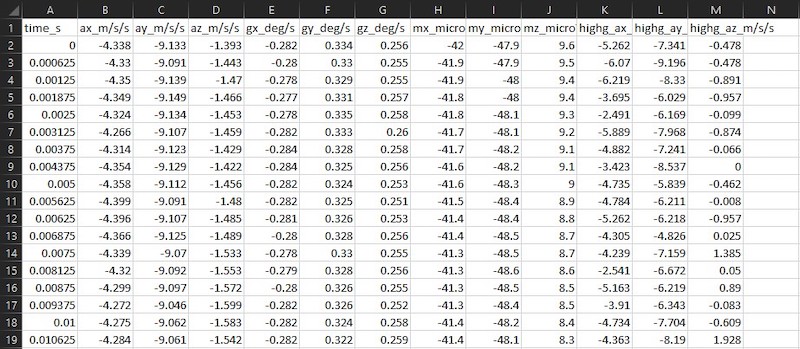
CSV – The raw data for each sensor component is output to multiple CSVs according to sample rate. If all sensor components are recorded during data capture, then three CSVs are output: high-g accelerometer @ 1600 Hz, low-g accelerometer and gyroscope @ 1125 Hz, and magnetometer @ 100 Hz. Use this option when raw, unprocessed data is of utmost importance!
X1D – A raw data file that can be opened in Vicon Nexus.
Aligned CSV – A single CSV containing all sensor component data, output at 1600 Hz. The data for the low-g accelerometer, gyroscope and magnetometers is upsampled to match the sample rate of the high-g accelerometer. Use when ease of access and handling data outweighs the need for millisecond synchronisation precision!
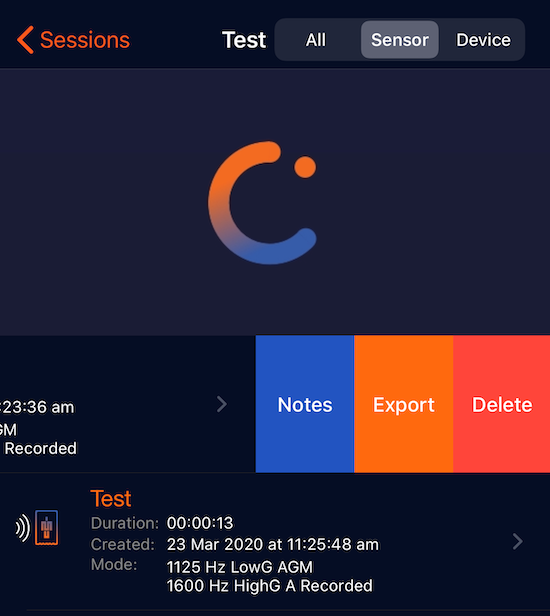
If there is reference video or notes made within the Capture.U iOS app during data capture, you will need to export those directly from the app by swiping the trial name left to bring up the options menu.
– Capture to Device
Capturing data to your device allows immediate access following the completion of a trial. This creates a single device workflow (i.e. no PC required), and allows you to process and visualise data in near-real-time, handy if you’re in the field or away from lab/workspace.
Once a capture is finished the CSVs are available directly on your device. And when you’re back online,reference video, notes and the data itself can be exported/uploaded off your device by swiping left on the trial to bring up the options menu.
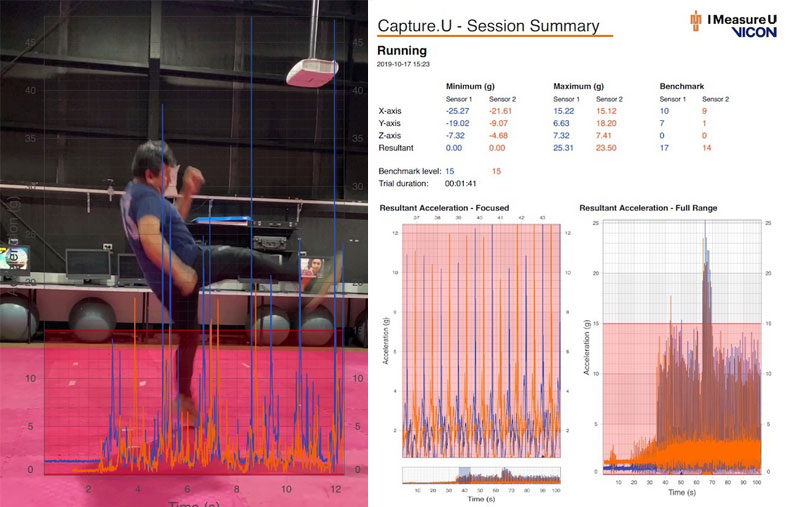
– Capture Real Time Insight
Real Time Insight (RTI) offers a powerful visual presentation of data with the option to underlay reference video. Following a recording, there are a few outputs available.
Video – The graphed data plus underlying video (if selected) can be saved locally to your device for viewing/uploading.
CSV – The raw data which is used to generate the graph can be output in CSV form for you to perform your own analyses or keep on record.
PDF Report – A quick report comprising a snapshot of the entire graph, a closeup of an area of interest (preselected by you) plus some descriptive measures from the data – minimums and maximums for each sensor/axis plus resultant, and if the benchmark/threshold values were set then a count from each sensor for when that value was exceeded.